Analysis methods for measurement data
For the detailed analysis of measurement data, we apply various methods each individually adapted to specific applications.
Possible measured variables are structural accelerations, displacements, strain and stress components, sound pressure levels, driving torques, forces, rotational speeds or temperatures.
Time series data of these quantities are recorded and analyzed applying one or several of the following methods:
- Spectral analysis: auto spectra, transfer functions, phase relation, coherence functions
- Waterfall diagrams and sonograms in order to analyze the time-development or the speed-dependence of spectra
- Order analysis, Campbell diagrams, order functions, Vold-Kalman filtering and resampling
- Wavelet analysis
- Deriving the speed from analogue or TTL signals; alternatively: using suitable vibration signals to extract the rotation speed
- Envelope analysis, Hilbert transformation
- Cepstrum analysis
- Displaying operating deflection shapes (ODS) for trace line models
- Expanding measured shapes to FEA models
- Low-pass, high-pass or band-pass filtering of measurement data
- Orbit analysis of vibrating rotor systems
The top figure shows as an example the Campbell diagram of a run-up, the mid figure shows the sonogram of an envelope analysis and the bottom figure shows the orbit of a rotating system.
Our specialists are always at your disposal to flexibly respond to your respective requirements and wishes.
Michael Elbs, Managing Director

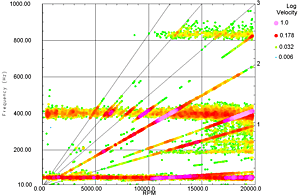
Example: Campbell diagram of a run-up
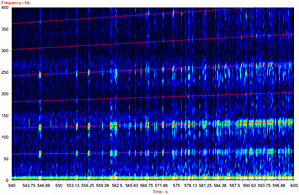
Example: Sonogram of the envelope analysis of strongly transient time series data
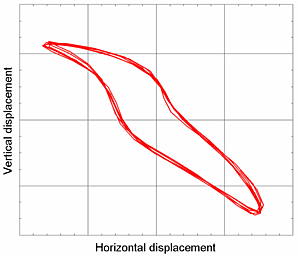
Example: Orbit of a rotating system